Saving $1600 With 8 Lines Of Python
I recently needed a copy of the IEA’s “World Energy Statistics and Balances” dataset for some analysis, but at a cost of €1,400, it was far too pricey for the project. Luckily, I found an alternative!
Casing the joint
The IEA provides an interactive Sankey diagram tool for exploring their energy data. As the tool works on the same dataset, it must be accessing the dataset through a limited proprietary server-side API, right? Wrong, it’s much simpler.
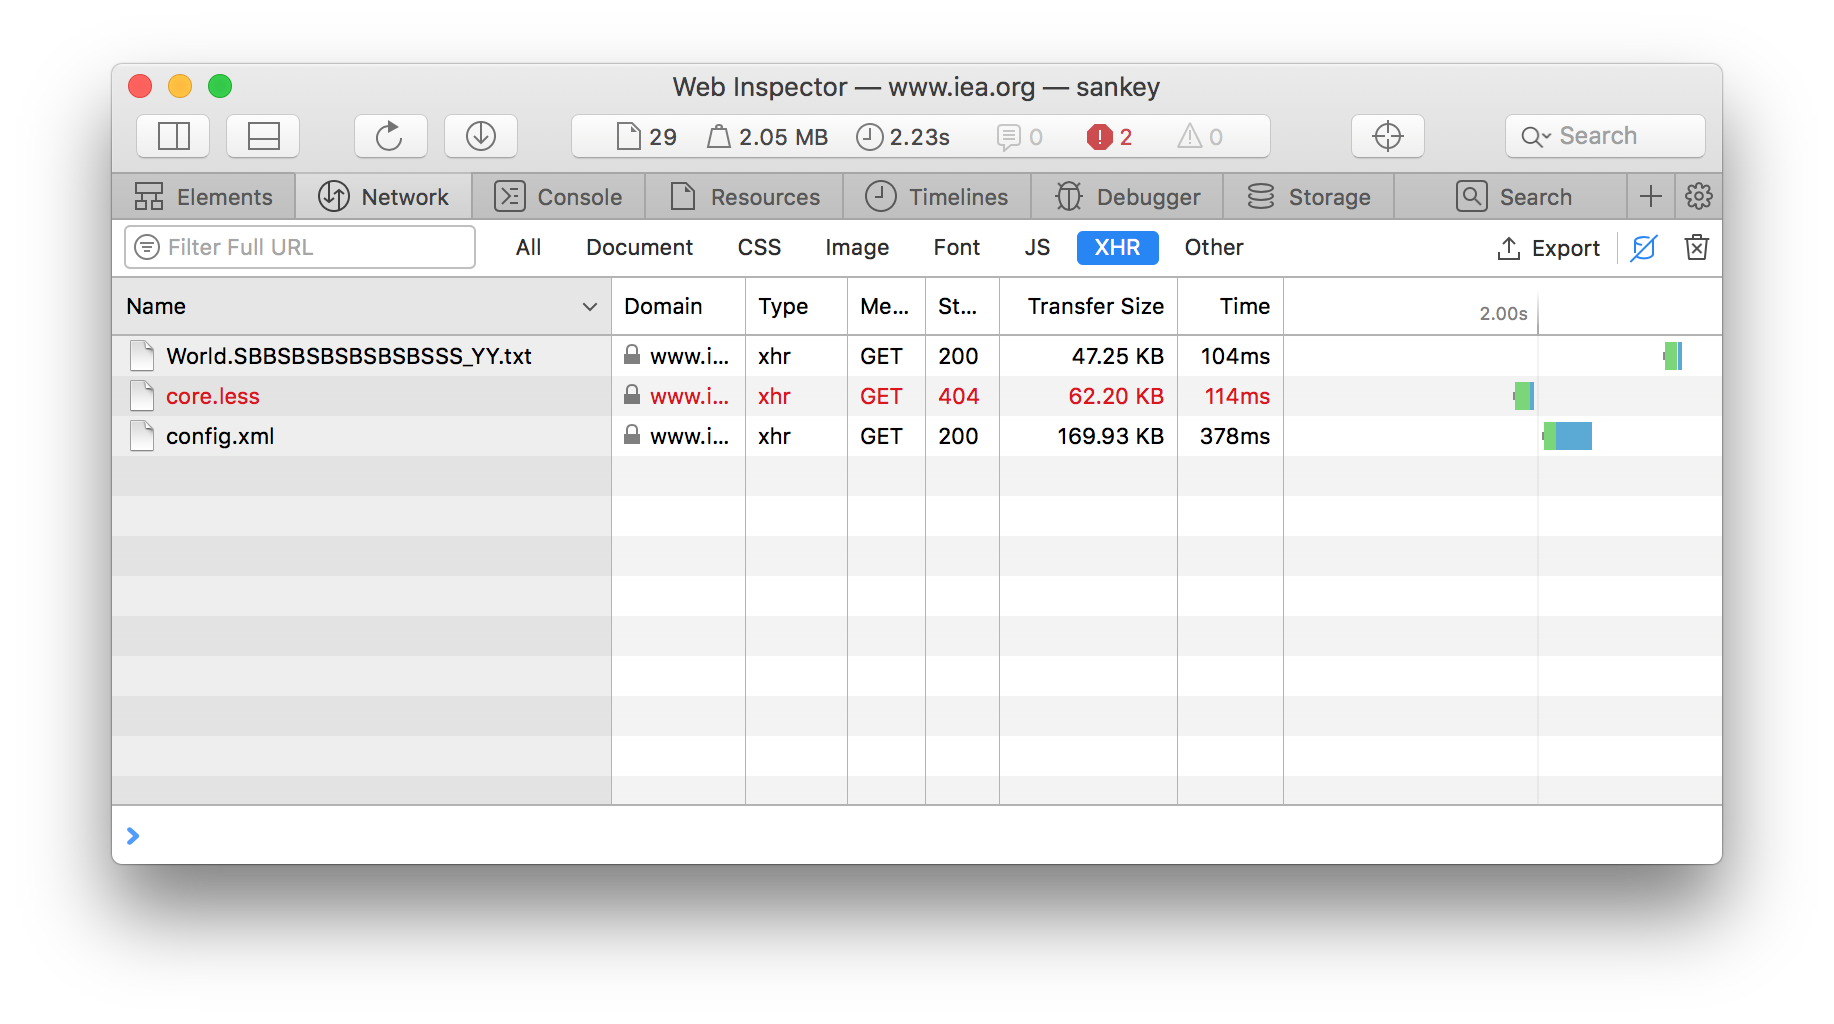
Looking at the XHR network activity in the browser dev tools reveals two files of interest: World.SBBSBSBSBSBSBSSS_YY.txt and config.xml.

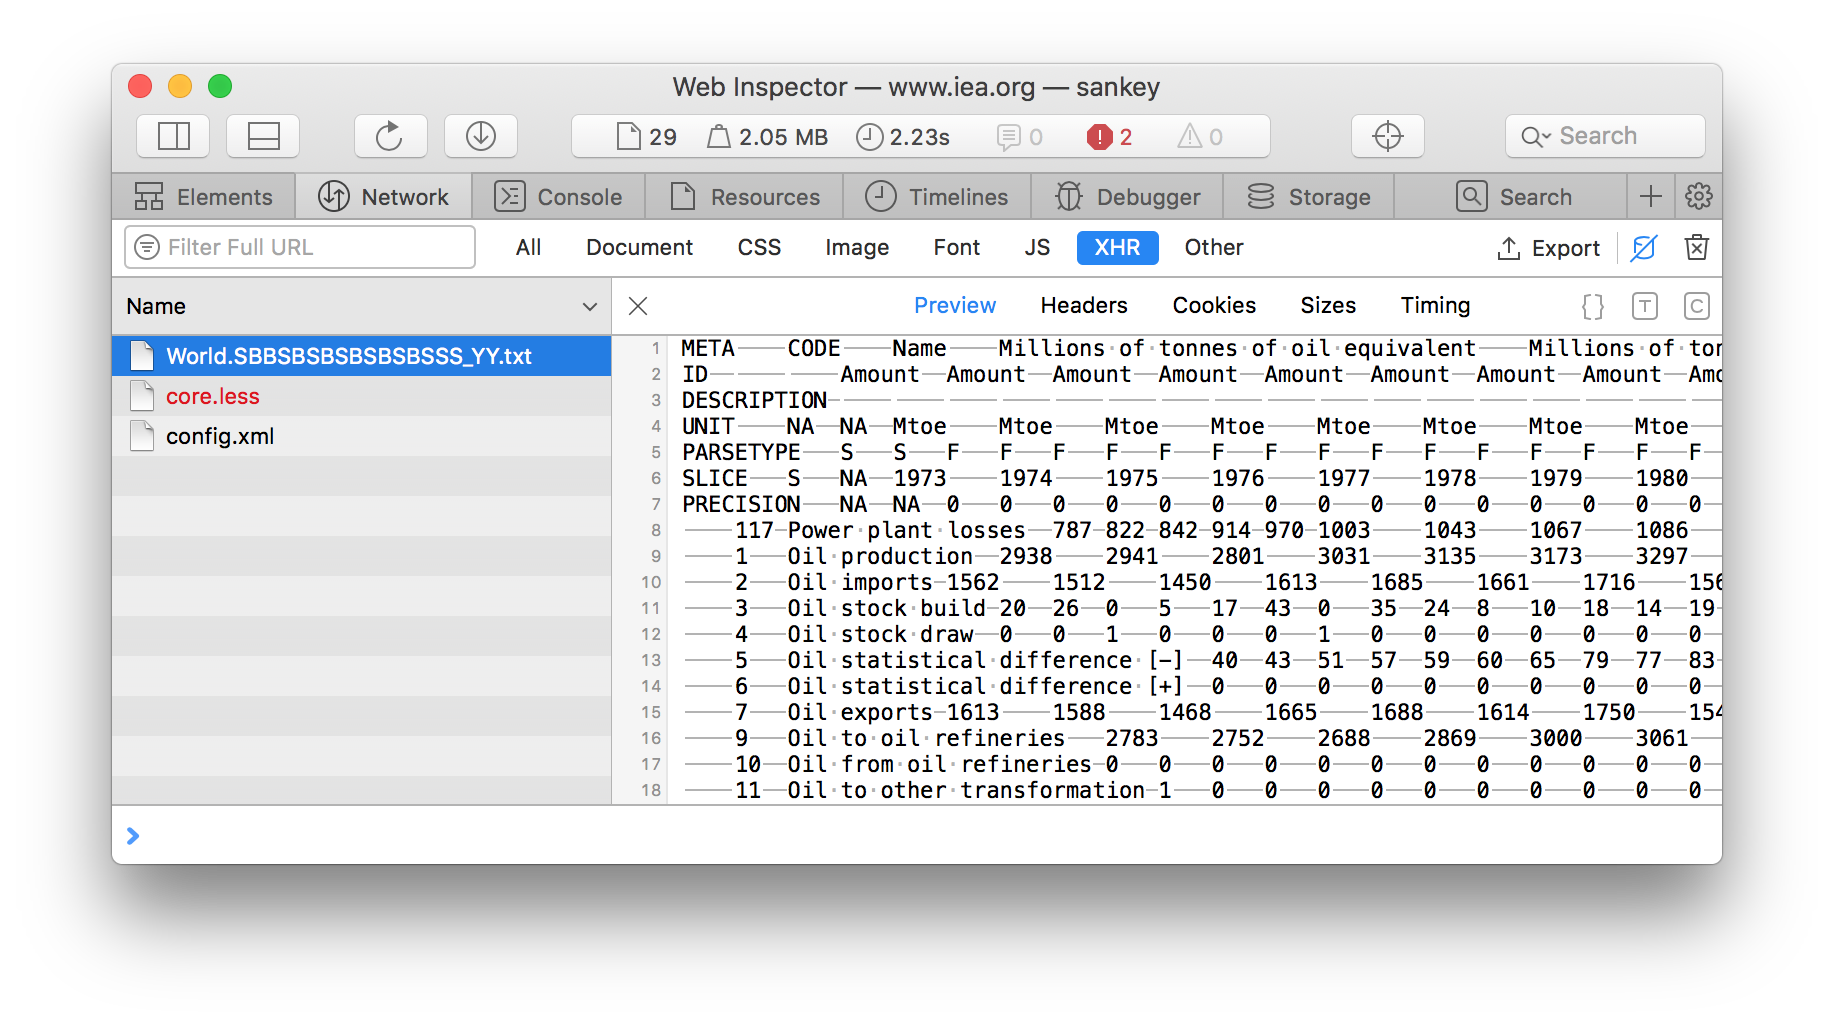
A closer inspection of the first file reveals that it has all of the IEA dataset totals for the World (but not the country-level data).
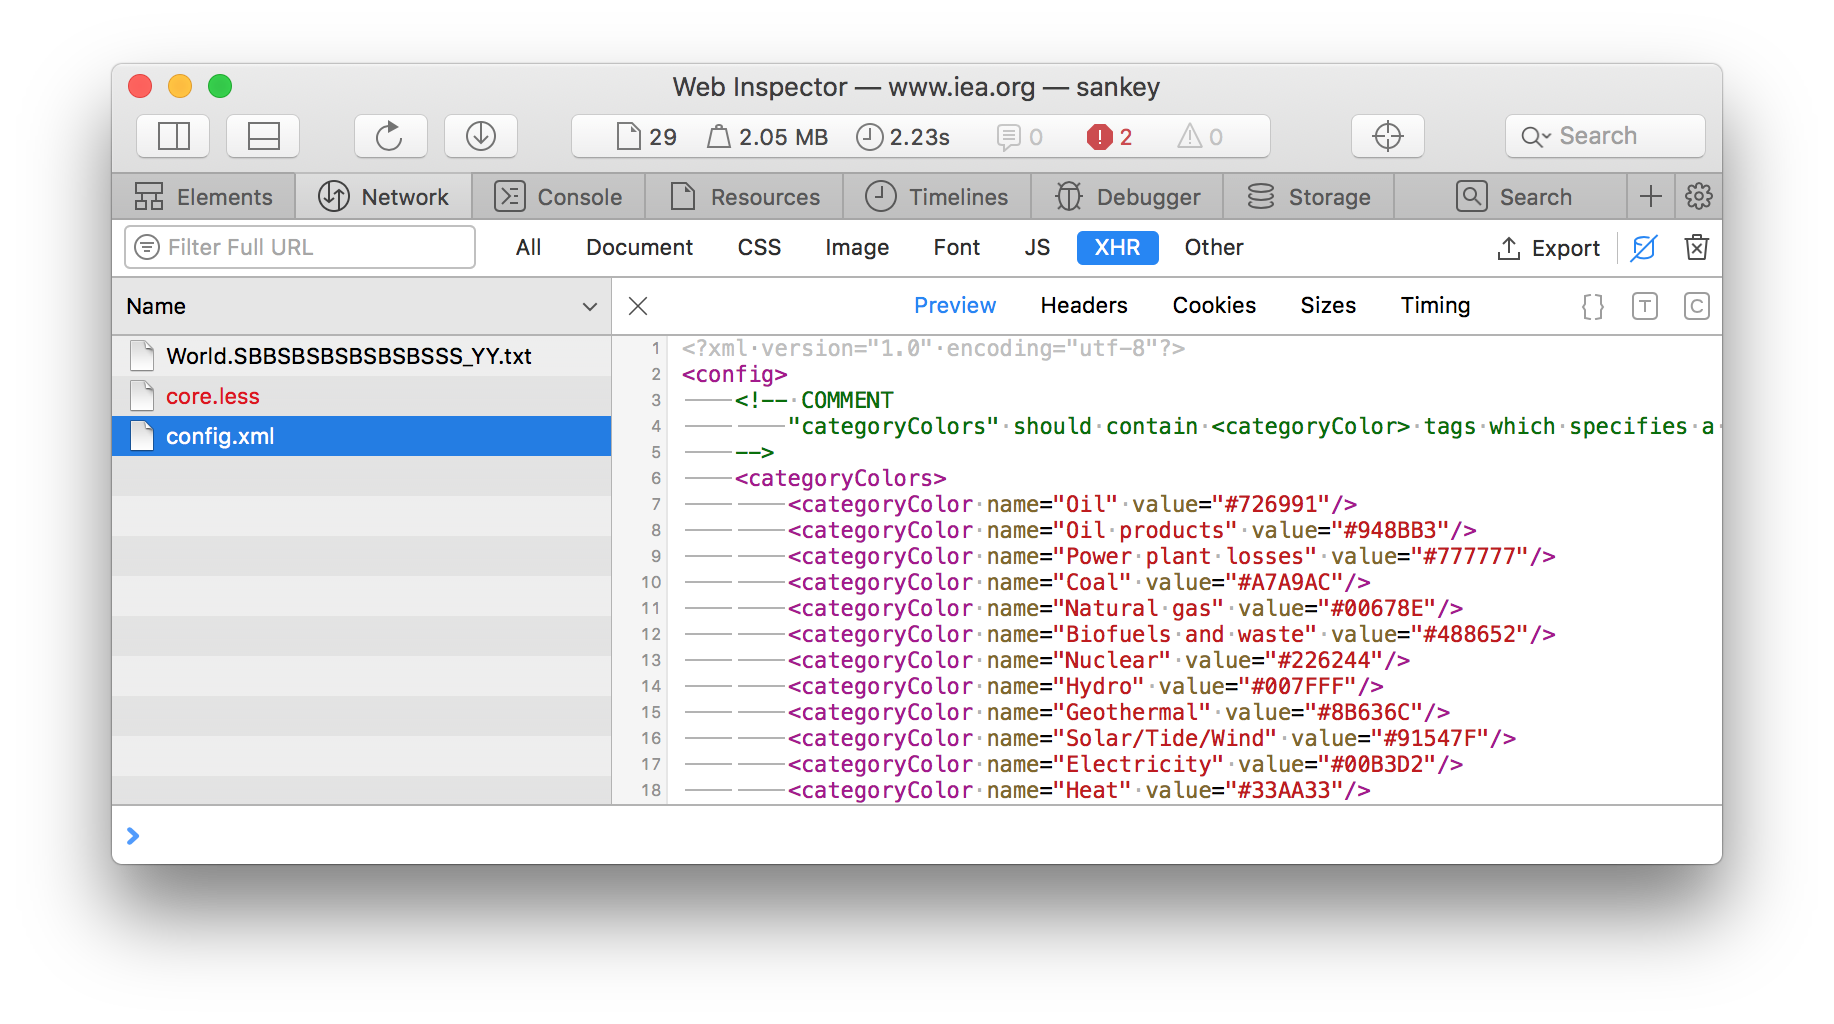
 An inspection of
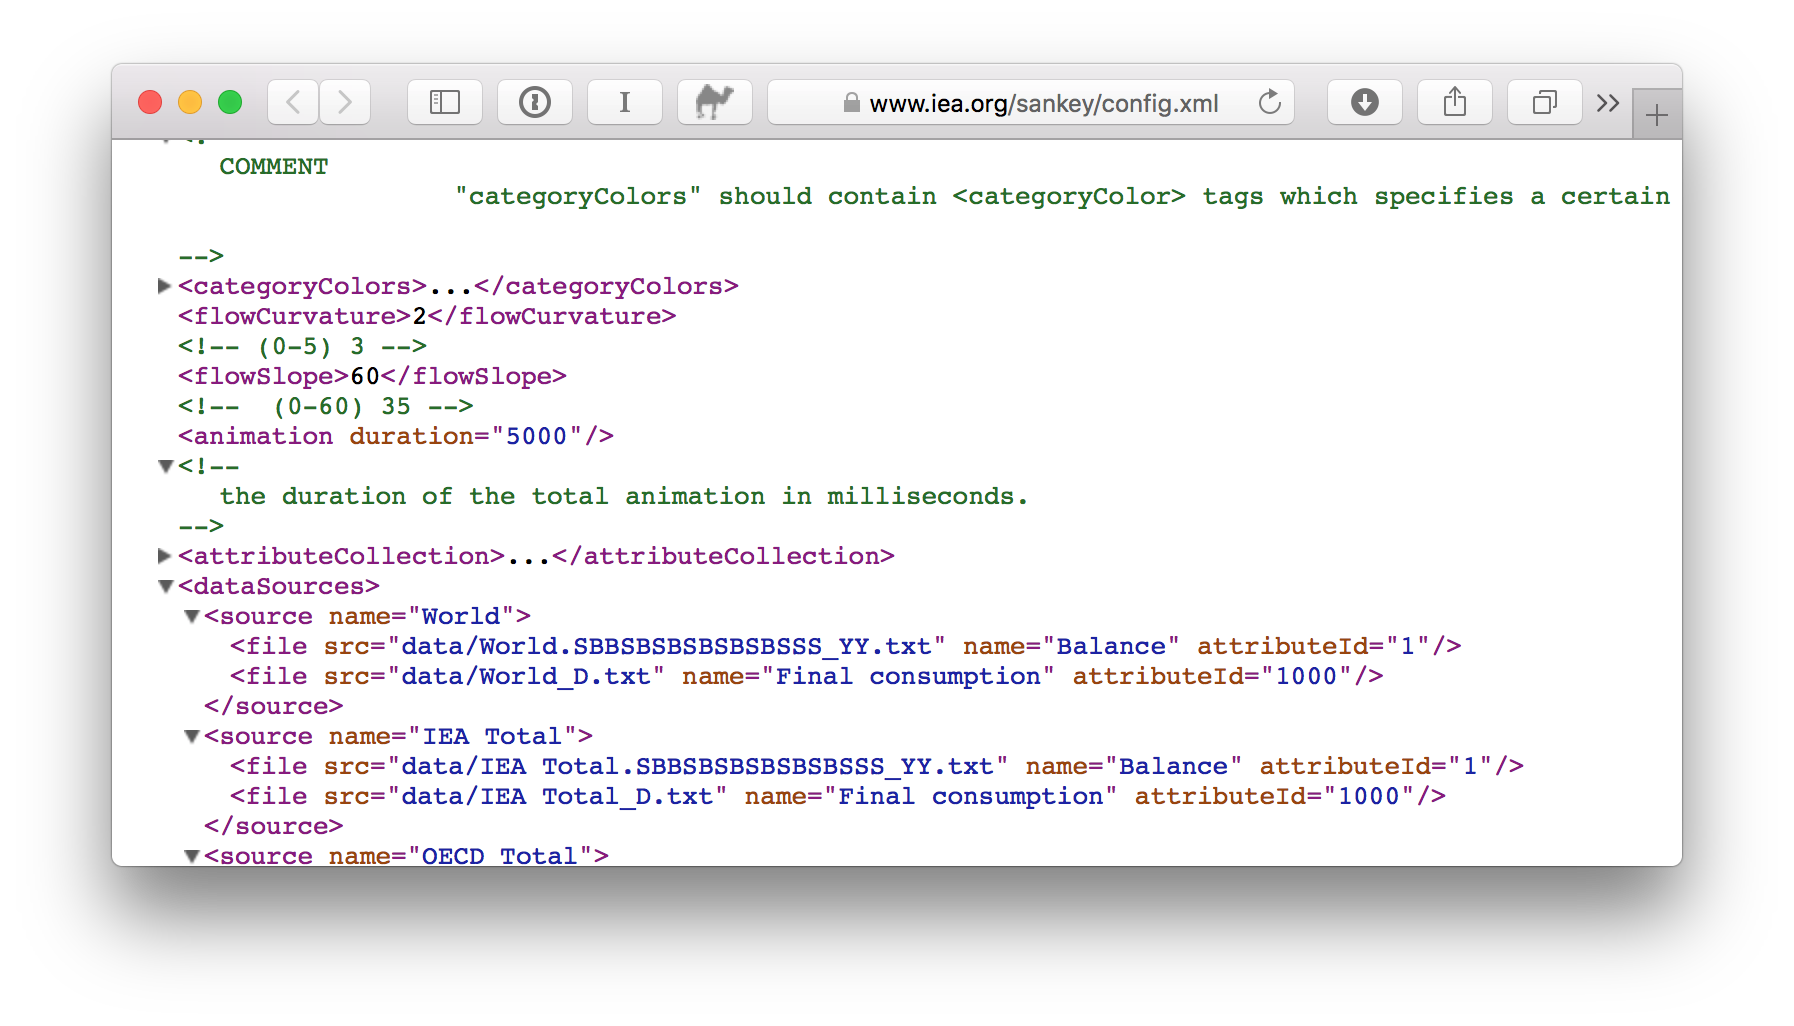
 config.xml reveals something more interesting. This appears to be the configuration file for the Sankey diagram app, with configuration for colors and animations. For us though, the <dataSources/> element is what we’re after.
 This section contains references to all of the data files for each country. With this file, we can scrape all of the dataset. We just need a little script to do so.

The job
This Python script will generate a file containing all the urls for the TSVs in the dataset. We can download all the files from the urls and get our dataset.
import urllib.request
from lxml import etree

res = urllib.request.urlopen("https://www.iea.org/sankey/config.xml")
root = etree.parse(res)

# find all the urls for data files (e.g. `data/Angola.BBBBBB_YY.txt`)
file_paths = (
    urllib.request.pathname2url(el.attrib["src"]) for el in root.iter("file")
)
urls = "\n".join(f"https://www.iea.org/Sankey/{path}" for path in file_paths)
with open("urls", "w") as f:
    f.writelines(urls)
We could use Python for downloading the files, but I find it easier to use wget to download all the files in parallel. This command will download all our files into the dataset/ directory.
xargs -n 1 -P 8 wget -P dataset < urls
Note: the data files are formatted in a weird way, which requires a little bit of work to format things correctly in Pandas. Also watch out for the duplicated columns. Each year is represented in Mtoe and PJ, at the same level in the table.